
Insights for Sales Leaders
Best practices, industry trends, and strategies to optimize your call center operations

Insight
By Allison Arzeno
2 min read
Agent Turnover: Insights From the Industry
This is a short version of The Onyx Operator — regular insights delivered to agency owners and leaders on Onyx Platform.
We recently pulled 12 months of agent roster data for agencies on Onyx. Between 30 and 45 percent of agents turned over within a year, and the larger the agency, the higher the churn. The working rule that emerged from the data: agencies should expect to lose about one agent every month for every 15 to 20 agents they have.
For a 50-agent agency, that means making 30 to 40 hires a year just to keep headcount flat. Our data shows that this is structural, not a sign that an agency is broken. Across the economy, the Bureau of Labor Statistics reports that roughly 3 percent of workers separate from their employers in a typical month. Industry studies of call center roles put annual turnover near 40 percent, with first-year attrition running far higher.
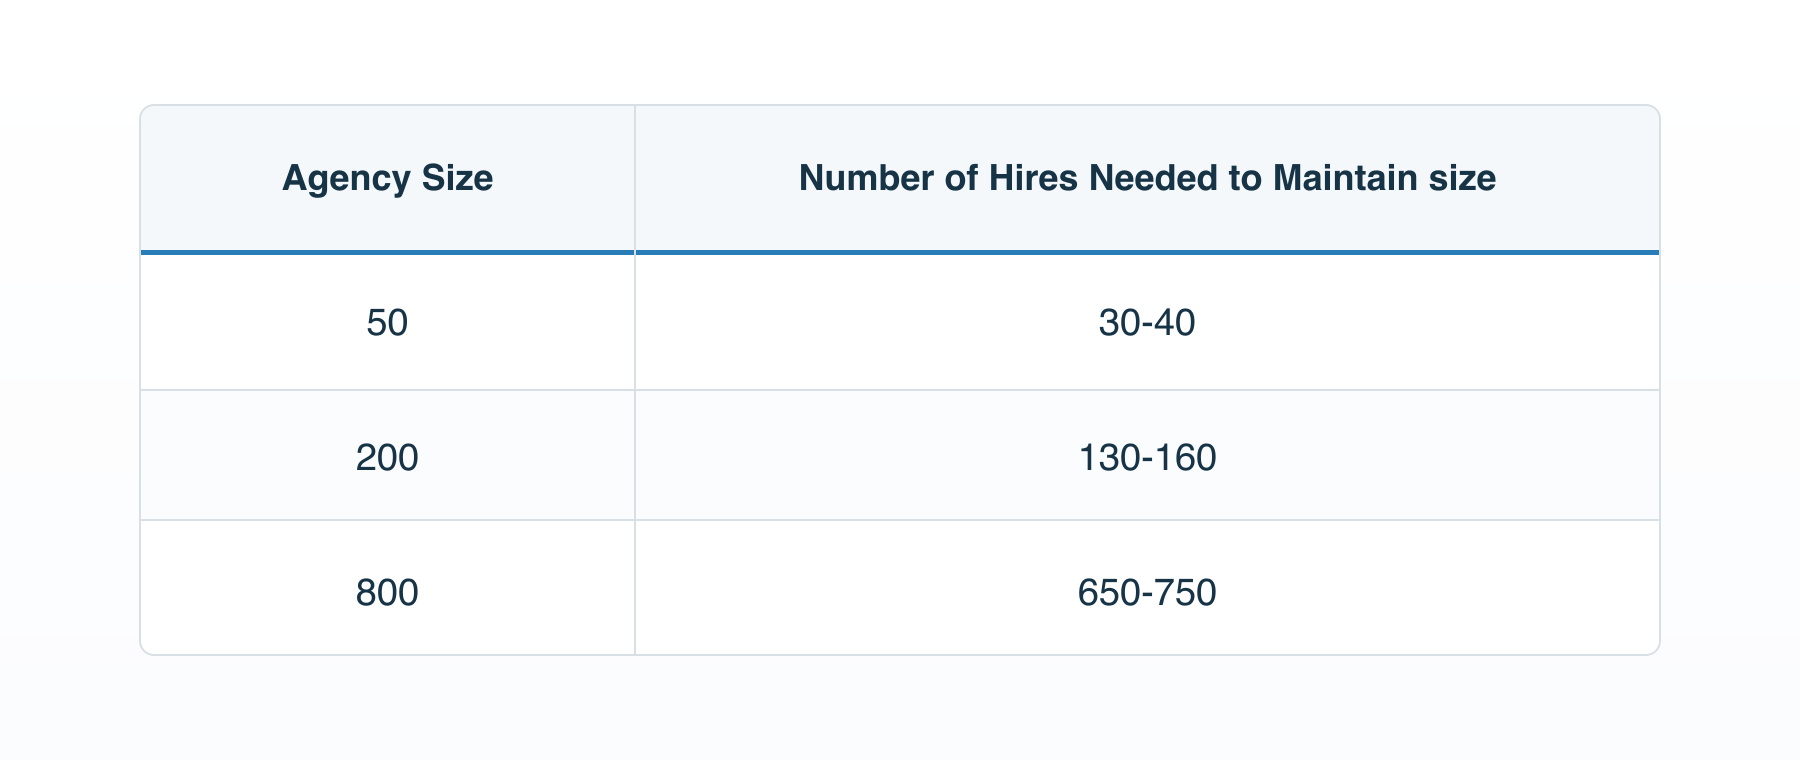
The owners who handle this well stop treating hiring as a rare activity that begins when someone quits. They run recruiting as an always-on pipeline, continually sourcing and screening so that when a seat opens on Monday, a qualified candidate is already in motion instead of leaving a four-week hole.
Talk to us to learn how we can help you build an always-on recruiting pipeline and keep pace with your workforce needs.
Read Article
More Articles

Guide
Insurance Retention Rate: Measure the Book You’re Actually Keeping
An insurance retention rate should answer a simple owner question: how much of the book you started with did you actually keep?
That answer gets blurry when an agency mixes new sales with renewals, counts customers and policies as if they were the same thing, or changes the treatment of cancellations from one report to the next. A growing book can make the operation look healthy even while a meaningful share of existing customers is leaving.
The fix is a clear definition, a consistent starting cohort, and an operating review that connects each loss to evidence and a next step.
Decide what your insurance retention rate measures
There is no single retention number that answers every question. Before calculating anything, decide what you are retaining: customers, policies, or recurring revenue. Each view can be useful, but each describes a different part of the business.
Customer retention follows the relationship
Customer retention asks whether a customer who was active at the beginning of a period still has at least one in-scope policy with the agency at the end. It is often the clearest owner-level view because it follows the relationship, not just an individual contract.
Suppose a customer replaces one policy with another appropriate policy through your agency. Policy-level reporting may show one policy lost and one policy added. Customer-level reporting can still show that the relationship was retained. Neither view is wrong. They answer different questions.
Policy retention and persistency follow the contract
Policy retention usually asks how many policies eligible to continue or renew remained in force through the defined checkpoint. In some insurance contexts, persistency is used for the same general idea. The exact duration and status rules still matter.
A renewal-based calculation is useful when policies have clear renewal dates. A duration-based view asks how many remain in force after a set number of months. Do not mix a 13-month persistency view with a calendar-year customer cohort.
Policy retention also needs a reliable status source. An agency record may show a submitted or issued policy before carrier confirmation arrives, or may lag a later cancellation or reinstatement. Label the source and timing so the report does not imply more certainty than the data supports.
Revenue retention follows the economics
Revenue retention asks how much recurring revenue from the starting cohort remains. It can expose losses that policy counts miss, but commission timing, advances, chargebacks, and carrier adjustments can make one period noisy. Define which revenue and transactions belong before using it.
How to calculate your insurance retention rate
For a customer-cohort view, use this formula:
Customer retention rate = eligible starting customers still active at the end ÷ eligible starting customers at the start × 100
The word “starting” does important work. New customers acquired during the measurement period do not belong in the retained starting cohort. Track them separately as growth.
Consider a hypothetical agency that begins the year with 1,000 eligible customers. At year-end, 880 of those customers still have at least one in-scope policy with the agency. The agency also added 150 new customers.
Starting cohort: 1,000
Starting customers retained: 880
New customers added: 150
Ending customer count: 1,030
Customer retention rate: 880 ÷ 1,000 = 88%
Net customer growth: 1,030 ÷ 1,000 - 1 = 3%
The agency grew its customer count by 3%, but it still lost 12% of the starting cohort. Looking only at the ending total would hide the amount of new production needed to replace those losses.
Use the same logic for policy retention, with eligible policies as the unit. For a renewal view, the denominator is policies available for renewal during the period and the numerator is those renewed. The Casualty Actuarial Society notes that retention comparisons change when organizations use different inclusion rules, such as whether they count company-initiated nonrenewals. That is why the definition belongs next to the rate.
Write the exception rules before you look at the result
Most retention disputes are really definition disputes. Write the treatment of common exceptions before calculating the rate, then use the same rules across periods.
Cancellations and nonrenewals
Decide whether the measure includes every customer or policy lost, only customer-initiated losses, or a separate view of each. An agency cannot learn much from a combined total if an unaffordable renewal, carrier exit, duplicate record, and service failure all receive the same label.
Keep the top-line calculation stable, then break losses into reason categories. If the reason is unknown, say so. “Unknown” is more useful than a guess because it shows where the follow-up process or source data is incomplete.
Reinstatements and delayed status updates
Choose a close date and a status-lag policy. Decide whether a later reinstatement restates the original month or appears in the next review, then apply that choice consistently.
Avoid silently rewriting prior reports. If a late carrier file changes the result, keep the original close, record the adjustment, and show the revised figure with an explanation.
Internal replacements and product changes
A customer may move from one policy to another while staying with the agency. Customer retention may remain intact even though one policy ends. Policy retention should show the contract-level movement, but the reason code should distinguish an internal, appropriate replacement from a customer lost to another agency.
Retention pressure should never push an agent to preserve unsuitable coverage. The customer’s needs, applicable rules, and qualified human judgment come first. The metric exists to improve the operating process, not to turn every policy ending into a failure.
Duplicate households, transfers, and acquisitions
Duplicate records can overstate cohort size. Producer transfers can look like losses, while an acquired book can create an artificial jump that says nothing about organic retention.
Treat these as data-quality and scope decisions. Deduplicate according to a documented rule, preserve the history of transfers, and report acquired cohorts separately until there is a comparable measurement period.
Pending and newly submitted business
A submitted application is not automatically an in-force policy. Set an eligibility rule for pending, issued, active, canceled, and terminated statuses, and identify which system supplies the authoritative status.
If carrier confirmation is delayed, the honest answer may be a provisional rate with a stated cutoff. Precision is not the same as certainty.
Compare cohorts that belong together
An agency-wide retention rate is a starting point, not a diagnosis. Segment the starting cohort by product, carrier, lead source, customer tenure, writing team, or other fields that reflect how the business actually operates.
Always show the retained count and starting count beside the percentage. A 50% result from two eligible customers is not comparable to an 88% result from 2,000. Small cohorts can swing sharply after one loss, and immature cohorts may not have reached a meaningful renewal or duration checkpoint.
Use segment rankings to find questions, not to assign blame. If one lead source has lower retention, the source itself may not be the cause. Product mix, customer tenure, status delays, onboarding, carrier changes, or a small sample could explain the gap. Review the underlying records before changing spend, compensation, or workflow.
Turn retention reporting into a monthly owner review
A useful review is short enough to repeat and specific enough to produce action. Run it on a fixed cadence with the same definition each time.
Freeze the cohort and cutoff. Record the beginning population, measurement window, status source, and close date.
Reconcile exceptions. Review duplicates, late updates, reinstatements, transfers, and internal replacements before discussing performance.
Read the top line and segments. Show customer, policy, or revenue retention with counts, then examine comparable cohorts.
Inspect losses. For each material loss, capture the reason, supporting evidence, responsible owner, and appropriate next action.
Close the loop. At the next meeting, review whether assigned follow-up happened and whether the loss reason or workflow changed.
This is where connected customer, policy, call, and activity data becomes useful. Onyx’s CRM keeps customer, policy, interaction, and note context together, while its reporting tools support custom views and filters. The agency still owns the metric definition, exception rules, and decisions that follow. Do not assume any platform’s default report matches your chosen cohort without checking it.
Measurement should also lead to better service, not just better reporting. If current policyholders are reaching acquisition queues, the agency can identify and route those conversations more deliberately. Onyx’s guide to recognizing policyholders on sales lines explains that workflow. For customers who are hard to reach synchronously, the article on texting as a service channel shows a different follow-up tactic.
A retention metric-definition checklist
Before an insurance retention rate reaches an owner dashboard, confirm that the team can answer these questions:
What unit are we measuring: customer, household, policy, member, or recurring revenue?
What event makes a record eligible for the starting cohort?
What exact period or duration are we measuring?
What status and source count as retained?
Are new customers excluded from the retained starting cohort?
How do we treat cancellations, nonrenewals, reinstatements, transfers, replacements, and pending business?
How are duplicates identified and corrected?
Which segments are large and mature enough to compare?
Are the numerator, denominator, cutoff date, and later adjustments visible?
Does every material loss have a reason, evidence, owner, and follow-up date?
If those answers change, version the definition and mark the break in the trend.
Protect the book by making losses visible
Retention is not a contest to produce the highest percentage. It is a way to see whether the agency is protecting the relationships and recurring economics it has already earned.
Start with one defensible cohort measure. Keep new production separate. Publish the counts behind the rate. Then use segments and loss reasons to decide where a service handoff, data fix, follow-up process, or owner decision deserves attention.
When the number is trusted, it changes the conversation. Instead of asking whether retention “feels fine,” the team can see what stayed, what left, why it happened, and who is responsible for the next step. If you want to see how connected customer, policy, and reporting data can support that review, book a demo.

Insight
Insurance Agency Valuation: What Makes Your Business Worth More
Valuing your agency is not just an exit exercise. It is a way to ask whether your agency's earnings, customer relationships, team, and records would still hold up if someone other than you had to understand and run the business.
That question matters even if you have no plans to sell. A business with durable earnings, a well-kept book, clear ownership, and dependable records is easier to manage, finance, transfer, or grow.
There is no universal formula that can tell you what your agency is worth. A credible valuation depends on what is being valued, why it is being valued, the financial evidence, the market, and the risks a buyer or appraiser sees.
This guide explains the main ideas at an owner-friendly level, then turns them into an operating checklist you can use without pretending to calculate a sale price.
What an insurance agency valuation actually measures
A valuation estimates the value of a defined business interest at a particular time and for a particular purpose. That’s a mouthful, so let’s break it down:
The whole agency is not always the same asset as its book of business. A book may include customer relationships, policies, and renewal economics. The operating business can also include employees, carrier relationships, processes, technology, brand, contracts, liabilities, working capital needs, and the ability to produce future cash flow without the current owner doing every important job.
Start by naming the subject. Are you discussing the operating company, a block of policies, a minority interest, or selected assets? Is the purpose a sale, succession plan, financing conversation, tax matter, or internal planning exercise?
This is why a casual revenue multiple can create false confidence. If someone quotes 1-2x or 6x revenue, ask what was sold, which earnings measure and deal terms sit behind the figure, and whether it came from a closed transaction. Neither number values your agency by itself.
How insurance agency valuation methods work
Professional valuation standards recognize several approaches. For an established agency, the two most intuitive are an income approach and a market approach. A qualified valuation professional may use one or more methods and reconcile the results based on the assignment and available evidence. To see how the methods differ, compare two hypothetical Medicare agencies with the same application volume but different operating structures. The figures are invented, not industry benchmarks.
The income approach looks at future economic benefit
An income approach connects value to the future income or cash flow the business is expected to produce, adjusted for timing and risk. Historical financial statements help establish patterns, but the past is not automatically the forecast.
An owner should expect questions about what revenue is recurring, what costs are required to sustain it, whether recent growth is repeatable, and which expenses or income items are unusual. "Normalized earnings" means financial results adjusted to better represent ongoing operations. The exact adjustments require judgment and support.
Do not assume every owner salary, family payroll item, or discretionary expense simply gets added back. A buyer may need to replace work the owner performs, and that replacement has a real cost. Normalization should make the economics more representative, not make the number as large as possible.
Consider the first agency. During Medicare's annual enrollment period (AEP), its agents submit 25,000 applications, and 20,000 policies become effective. Agents make data-entry mistakes on 800 applications, and every correction goes to the owner. The owner also holds the upline relationship and is the sole contact for carrier appointments and escalations.
The agency reports $200,000 in operating profit after paying the owner a $300,000 salary. If a buyer simply adds back that salary, earnings appear to be $500,000. But a buyer still needs someone to do that work. Assume the agency would need an enrollment-operations lead at $180,000 a year and a carrier/upline relationship lead at $150,000. After those replacement salaries, illustrative earnings are $170,000 before benefits, transition costs, or other adjustments.
An income-based analysis would test whether that level of earnings can continue, rather than annualizing the best AEP. The agency could also reduce the dependency: log each correction, route routine fixes to an operations queue, define which exceptions need escalation, and have the new leads run the process and partner contacts while the owner is still there.
The market approach compares relevant transactions
A market approach uses evidence from sales of comparable businesses or interests. Multiples can express those comparisons relative to revenue, seller's discretionary earnings, or EBITDA.
The hard part is comparability. Agency size, line of business, margins, growth, retention, carrier mix, customer concentration, geography, owner involvement, and transaction terms can all matter. A multiple drawn from a small local book may not fit a larger operating company. An advertised asking price is not the same as a closed transaction. A headline multiple may also describe a different earnings measure than yours.
Treat insurance agency valuation multiples as evidence that needs context. Ask what population produced the number, when the transactions occurred, what financial measure was used, and how your agency differs.
Now compare a second hypothetical Medicare agency. It also submits 25,000 AEP applications, has 20,000 effective policies, and collects $10 million in commission revenue. Its agents generate 650 data corrections, but a staffed queue handles routine fixes and an operations manager reviews unresolved cases. Two managers maintain upline and carrier contacts, and agents are appointed with alternatives in the counties where the agency sells. Suppose this agency closes at $4.8 million on $1.2 million of normalized annual earnings, with the seller staying for a one-year transition. That is a 4x earnings multiple for this invented transaction, not a market benchmark. Applying 4x to the first agency without accounting for its $170,000 illustrative earnings, owner-controlled corrections, appointment gaps, and different transition terms would not compare like with like.
Five operating questions that shape agency value
Owners cannot control the market multiple available years from now. They can improve the quality of the business and the evidence behind it. The following framework is not a professional valuation method. It is an operating review built for life, health, Medicare, and ACA agencies. The examples are hypothetical and show what an owner could investigate, not what any agency is worth.
1. How durable are the earnings?
A single strong season does not tell the full story. A reviewer will want to understand where revenue comes from, what it costs to produce, how results change by season, and whether performance is repeatable.
Consider the same Medicare agency across two AEPs. In the earlier season, 20,000 applications produced 16,000 effective policies and $8 million in collected commissions. Leads cost $100 per submitted application, or $2 million total. After $2.4 million in agent pay, $2 million in other operating costs, and the owner's $300,000 salary, operating profit was $1.3 million. In the recent season, applications rose to 25,000 and effective policies to 20,000, bringing collected commissions to $10 million. But lead cost rose to $180 per application, or $4.5 million total. Agent pay was $3 million; the other costs and owner salary stayed the same. Operating profit fell to $200,000. At 25,000 submissions, another $8 in lead cost per application would erase that remaining profit if the other assumptions held. More applications and more revenue did not make earnings more durable because acquisition cost grew faster. All figures are hypothetical.
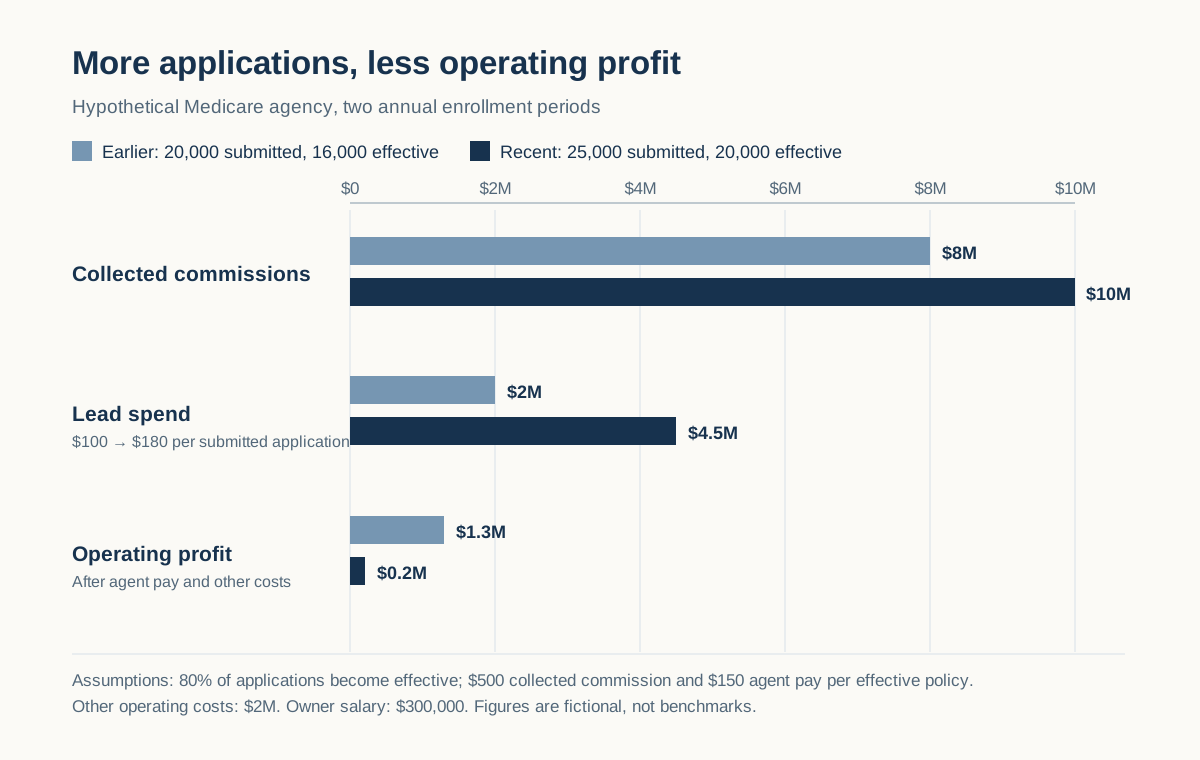
Image: Hypothetical Medicare AEP comparison, applications rise from 20,000 to 25,000, while higher lead costs cut operating profit from $1.3 million to $200,000.
Evidence to maintain: monthly revenue and expense statements using consistent categories; production and conversion trends by product and source; staffing and marketing costs tied to the same periods; written explanations for material one-time items.
Operating action: compare commission revenue, lead spend, submitted applications, effective policies, and early cancellations by campaign and season. Set a trigger for pausing or renegotiating a lead source when its economics deteriorate. Reconcile the operating and financial reports before using the trend in a valuation discussion.
2. How well does the book retain?
New production gets attention, but future economics depend on how much valuable business remains. Retention or persistency should be defined carefully for the products you sell. Policy count, premium, members, and commission revenue can produce different views, and early cancellations may matter differently from later attrition.
Take the 20,000 policies that became effective in the recent AEP. The CRM lists 19,200 as active after 90 days, but carrier statements show expected payments on only 18,700. The 500-policy gap could reflect delayed statements, stale CRM statuses, or early cancellations. Operations reconciles the policies by ID before the owner treats the CRM number as a retention rate.
Evidence to maintain: a documented retention definition; cohort views by effective period, product, carrier, source, and producer where appropriate; cancellation reasons that are specific enough to act on; reconciliation between policy status and revenue records.
Operating action: assign an owner to the 500-policy gap. Separate policies that never became effective from early cancellations and delayed payments, then review the next cohort using the same definitions.
3. Where is the business concentrated?
Concentration can make good results more fragile. An agency may rely heavily on one carrier, product, lead source, producer, vendor, state, or season. The issue is not that concentration is always bad. It is whether the owner understands the exposure and has a credible response if that dependency changes.
For example, a Medicare agency has 8,000 active policies with one carrier. Of those, 3,000 are in two counties that the carrier will leave next plan year after a service-area reduction. The agency and most of its agents have not completed appointments with other carriers in those counties. The owner cannot assume the affected members will simply move to another plan or that the renewal revenue will remain. A concrete response is to identify affected policies by plan and county, confirm which alternatives are available, complete agency and agent appointments and training, and prepare compliant member support before the change takes effect. That is a much stronger answer to a buyer than saying the agency can diversify later.
Evidence to maintain: revenue and policy distribution by the categories that matter to your business; trend lines rather than a single snapshot; contract or appointment dependencies; a record of contingency plans and tested alternatives.
Operating action: keep a county-level list of affected policies, available plan options, and which agents have completed the required appointments and training. Assign one manager to keep that list current before AEP.
4. How dependent is delivery on the owner?
An owner can be the agency's greatest strength and still create transfer risk if every exception, relationship, and approval runs through them. The same problem appears when a star producer or operations lead holds the playbook in their head. A buyer can take over a business whose workflows, customer context, and performance survive changes in personnel. If results depend on particular people agreeing to join the buyer, the deal may look more like an acqui-hire than the purchase of a transferable operating business. That can narrow what the buyer is paying for; it is not a fixed pricing rule.
In the 25,000-application agency, 300 of the 800 data corrections arrive in the final two weeks of AEP and go straight to the owner's inbox. When the owner is away, nobody can see which cases were fixed, which need resubmission, or which carrier contact can resolve an exception. The agency may have produced a large book, but the correction process and partner access still belong to one person.
Evidence to maintain: clear role ownership; approval thresholds; current process documentation for critical workflows; delegation records; performance reporting that does not require the owner to reconstruct the story.
Operating action: move the 800 corrections into a shared queue with error codes, owners, due dates, and escalation rules. Have the operations and carrier leads run the queue and partner calls for two weeks while the owner observes rather than resolves cases.
5. Can another person verify the records?
Clean records do more than make diligence easier. They let the owner run the agency with confidence. Customer, policy, call, lead, producer, compliance, and financial records should connect well enough that another qualified person can follow an important result back to its source.
This does not require putting every function in one product. Specialized quoting and enrollment systems can remain specialized. The question is whether handoffs are defined, identifiers stay consistent, exceptions are visible, and reports agree with the records used to do the work.
For example, finance reports $10 million in commissions from the recent AEP cohort. The CRM holds 25,000 submitted applications, while the carrier files show 20,000 effective policies. If 400 carrier records cannot be matched to an application ID, another person cannot reproduce the $10 million figure without manual explanations. The agency should reconcile those IDs and retain the exceptions, not just hand over the summary total.
Evidence to maintain: named systems of record for critical fields; consistent identifiers; access and change controls; documented reconciliations; retained source records; definitions for the metrics leadership uses.
Operating action: start with the $10 million commission report. Match carrier payments to effective policies and application IDs, investigate the 400 unmatched records, and record who approves each resolution.
Onyx's insurance management system guide explains how a shared operating foundation can connect the record, the work, and owner control. The technology growth scorecard can help you assess whether the current stack supports reliable growth. Neither replaces a professional valuation.
A value-driver checklist for this quarter
You do not need an active transaction to make the agency more understandable. Use this six-step review on one value driver at a time:
Name the driver. Choose durable earnings, retention, concentration, owner independence, or record quality.
Define the measure. Write down exactly what is included, excluded, and when it is measured.
Name the source. Identify the authoritative system or record behind the number.
Assign an owner. Make one person accountable for the definition, data quality, and review cadence.
Show the trend. Keep comparable monthly or quarterly history and explain material breaks.
Take one operating action. Fix a handoff, reduce a dependency, document a decision, or reconcile a disputed number.
For example, imagine an agency that reports strong renewal revenue but cannot reproduce retention by cohort. The valuable first step is not applying a higher multiple. It is defining the retention measure, reconciling policy statuses to revenue, and assigning responsibility for exceptions. The result is better operating evidence whether the owner holds the business for ten years or explores a transaction later. This example is hypothetical and does not estimate value.
Build a business that is easier to understand and trust
Useful valuation work begins before anyone asks for a price. Durable earnings, a retained book, managed concentration, a capable team, and verifiable records make the agency easier to run and give professionals better evidence if a valuation becomes necessary.
Avoid chasing a single rule of thumb. Decide what is being valued, keep the financial definitions honest, and improve one documented value driver at a time.
Onyx helps telephonic life, health, Medicare, and ACA agencies connect CRM, calls, lead routing, policy context, compliance, and reporting on one operating foundation. If you want to see how your agency's day-to-day records and workflows can become easier to manage and verify, book a demo.

Guide
Insurance Software Products: 7 Categories Agencies Actually Need
Search for insurance software products and you will find systems built for almost every part of the industry. Some help carriers design policies, manage billing, or process claims. Others support P&C brokerages. Still others are made for individual producers, field sales, or large contact centers.
That broad market can make a software search harder than it needs to be for a Medicare, ACA, health, or life agency. You need to know which categories support your operation, where they overlap, and which handoffs create extra work when systems do not share data.
This guide maps the seven categories that matter most to telephonic agencies and FMOs. It also gives you a practical way to decide when a specialist product earns its place and when consolidation is the better operating choice.
Insurance software products serve different parts of the market
The phrase “insurance software” groups together buyers with very different jobs. A carrier may need policy administration, underwriting, billing, and claims systems. A P&C brokerage may center its operation on submissions, policy downloads, renewals, and certificates. An individual producer may only need contact management and application tools.
A telephonic Medicare, ACA, health, or life agency has a different center of gravity. Its daily operation moves from lead intake to routing, conversation, customer record, enrollment handoff, follow-up, compliance review, and reporting. An FMO also needs visibility and consistency across agencies without taking operating judgment away from each owner.
Before comparing brands, confirm which part of the insurance market a product was designed to run. A capable carrier or P&C tool may still be a poor fit for a phone-based health or life sales floor.
Seven insurance software product categories to map
1. Customer relationship and agency records
The customer system holds the working record of people, policies, conversations, notes, dispositions, appointments, and open tasks. Vendors may call it a CRM or include it in an agency management system.
For a telephonic agency, the record must be useful during a live conversation. An agent should understand what happened before, capture the outcome, and leave a clear next step. Managers need a trustworthy history without rebuilding it from call logs and spreadsheets. A record that only receives summaries after the work happens elsewhere is an archive, not the operating center.
2. Dialer and contact-center software
Dialer software manages inbound and outbound calls, queues, transfers, recordings, dispositions, and agent availability. The right mode depends on lead sources, staffing, consent practices, call volume, and manager control.
The key boundary is the customer record. Calls should connect to the same lead, agent, campaign, and outcome used by the rest of the business. When telephony and the CRM disagree, managers can see activity without understanding results. Onyx's guide to choosing a CRM, dialer, and AMS gives a focused comparison of those three core systems.
3. Lead distribution and license-aware routing
Lead management products accept opportunities from different sources, apply eligibility and priority rules, and assign them to the right team or agent. In a multi-state insurance operation, routing may need to consider state licensing, product, line of business, schedule, capacity, language, campaign, and other approved agency rules.
Basic assignment exists in many CRMs. The real test is whether the product explains who was eligible, why one person received the lead, what happened when nobody qualified, and how the outcome returns to the source. A separate routing tool can fit specialized rules. It becomes costly when every change requires another sync and another version of agent data.
4. Quoting and enrollment software
Quoting and enrollment products help an agent compare options, complete the appropriate workflow, and submit or record an enrollment. They are purpose-built for a job that a CRM, dialer, or operating platform should not pretend to perform if it does not.
The purchasing question is whether the handoff works in both directions. The agent should reach the right enrollment workflow with the needed context, while approved customer and policy information should return without unnecessary re-entry. Field ownership should be clear when systems disagree.
5. Compliance, call recording, and quality assurance
Compliance and QA software can support recording, retention, transcription, scorecards, review queues, coaching, and evidence for an audit process. The category ranges from narrow recording products to broader review systems tied to the customer and call workflow.
Keep people accountable for conclusions, exceptions, remediation, and review standards. Software can organize evidence and surface calls for attention, but it does not replace qualified compliance or legal judgment. Reviewers should be able to trace a finding to the conversation, document the resolution, and spot patterns.
6. Reporting and business intelligence
Reporting products turn operational data into dashboards, scheduled reports, and answers for owners and managers. Specialist business-intelligence tools can be valuable when an agency has analysts, several mature data sources, or complex modeling needs.
First ask whether routine reports use the same records that drive daily work. If calls, leads, policies, tasks, and QA findings use different identifiers, a more powerful dashboard will not repair the foundation. Reporting is easier when it sits close to operational data instead of reconstructing workflows afterward.
7. Commissions, accounting, and back-office operations
Commission software supports statement intake, hierarchy rules, expected-versus-paid reconciliation, splits, exceptions, and producer visibility. Accounting systems handle the broader financial record. These products solve a different problem from sales workflow software, even though they may depend on the same policy, carrier, agent, and hierarchy data.
Treat this as a current-state-sensitive category. Confirm what a vendor supports today, which rules require manual work, and how corrections flow to the underlying record. A roadmap slide is not a live capability. If commissions remain in spreadsheets, define the data and reconciliation process before buying automation.
Which products should share an operating platform?
Not every product needs one vendor. Quoting, enrollment, accounting, and specialist analytics may remain separate because they have clear responsibilities. Consolidation matters most where work forms one continuous loop on shared records.
For a telephonic agency, CRM, calls, lead routing, compliance, QA, and core reporting often share that loop. The lead determines the route. The route determines which agent and script appear. The conversation updates the customer record. The recording feeds review. The outcome feeds follow-up and reporting. When each step lives in a separate product, the agency becomes responsible for keeping the whole chain intact.
An operating platform need not replace every specialist. It should be the system of record and action for the agency, with deliberate boundaries around quoting, enrollment, accounting, and other specialist jobs. The goal is fewer ambiguous handoffs, not a larger feature list.
Point tool or platform: use the handoff test
Keep a point product when depth matters more than shared workflow
A specialist tool earns its place when it performs a distinct job materially better, has a clear owner, and exchanges a small, well-defined set of data with the rest of the stack. Your team should know which system owns the record, what enters and leaves the product, how failures are detected, and what happens during an outage.
Quoting and enrollment are common examples because they have a defined purpose outside the daily CRM and call workflow. A specialist analytics product may also make sense for an FMO with a data team and needs that go beyond operating dashboards.
Consolidate when the handoff has become the work
Consolidation deserves attention when agents repeatedly switch tabs, data is entered twice, routine reports require reconciliation, or a workflow change depends on several vendors. The same is true when managers cannot trace a lead from source through conversation and outcome without assembling the story by hand.
This does not mean buying the product with the most modules. It means choosing a foundation that keeps closely related work on shared records, with permissions, configuration, and reporting owners can understand. The five-tool problem is not the number of subscriptions by itself. It is the operating burden created between them.
A practical stack map for agencies and FMOs
Draw the workflow before listing vendors. Put the customer and policy record in the center. Map lead intake, eligibility, calls, enrollment handoffs, follow-up, review, and owner reporting.
Then mark every handoff with four facts: the sending system, the receiving system, the record owner, and the person responsible when it fails. This usually reveals three types of products:
Core operating products: used throughout the day and responsible for shared records, calls, routing, review, and operating visibility.
Specialist products: responsible for a defined job such as quoting, enrollment, commissions, accounting, or advanced analytics.
Temporary bridges: spreadsheets, exports, manual lookups, and one-off connections that exist because the core products do not agree.
For an FMO, add one question: which data and playbooks should be shared, and which decisions remain with each agency? The detailed life and health agency management software buyer's guide goes deeper on requirements for growing call centers.
Questions to ask before adding another insurance software product
Use these questions with your operations team before the next demo. They force the buying discussion toward ownership and workflow instead of feature count:
Which exact job will this product own?
Which system remains the source of truth for customers, policies, agents, and outcomes?
What data must move into and out of the product, and how quickly?
What happens when the data is missing, duplicated, delayed, or wrong?
Can the team complete the workflow without copying information between systems?
Can managers trace an outcome back to the lead, call, agent, and rule that produced it?
Who can change configuration, permissions, and routing logic?
How will the product work across teams, agencies, and lines of business?
What does the agency need to monitor, maintain, and reconcile after launch?
If the product is removed, can the agency retrieve its records and keep operating?
The answers make vendor comparisons more concrete. They also reveal whether you need a new product, a better connection, or a stronger operating foundation.
Build the stack around the agency you want to run
The right set of insurance software products is not the longest possible list. It is a clear operating design: shared records for connected work, specialist depth where it matters, visible ownership at every handoff, and enough flexibility for the people running the business to change the rules.
Map the operation first. Keep products that solve distinct jobs. Consolidate where gaps become a recurring management burden. To see how Onyx connects CRM, calls, lead routing, compliance, QA, and reporting with the specialist tools your agency needs, book a demo.

Guide
Insurance Agency Commission Software: What to Evaluate
Insurance agency commission software should help you answer three questions without rebuilding the math every month: What did the agency expect to earn? What did carriers actually pay? What does the agency owe producers, agencies, or uplines?
A spreadsheet can answer those questions when the book is small, the hierarchy is simple, and one person understands every rule. It gets harder when an agency adds carriers, products, states, producers, overrides, split arrangements, and downline agencies. The problem is not that spreadsheets cannot calculate. It is that they make ownership, history, exceptions, and approvals difficult to manage at the same time.
The right replacement is not simply a prettier calculator. It is a controlled commission workflow that connects policy and producer data to statements, reconciliation, approvals, and reporting. This guide explains what to evaluate before you move.
What insurance agency commission software should do
Commission tracking software sits between several records that may disagree. A carrier statement says what was paid. A policy history says what was written and remains in force. A compensation schedule says how revenue should be allocated. A producer hierarchy says who participates in the payout. Finance needs to turn those inputs into an answer people can inspect.
At a minimum, the software should support four jobs:
Import or capture carrier commission statement data.
Match statement lines to the right policies, producers, and compensation rules.
Compare expected and received amounts, then route exceptions for review.
Calculate and communicate approved producer or downline payouts.
Not every product covers all four. Some tools focus on tracking agency revenue. Others specialize in producer compensation or are modules inside a larger agency management system. Define the job you need done before comparing feature lists.
When spreadsheets stop being a dependable system
Replacing a spreadsheet is disruptive, so frustration alone is not a good reason to buy software. Look for repeated failure patterns.
More people are editing than reviewing
If several people can change formulas, mappings, or producer rates without a clear approval path, the workbook is doing more than analysis. It has become an operational system without operational controls.
Version names such as “final,” “final v2,” and “corrected” are a warning. So are copied tabs that preserve old logic nobody can explain. The issue is not appearance. It is the difficulty of proving which rule and source produced a payout.
Reconciliation depends on one experienced employee
Commission operations often accumulate exceptions that only one person knows how to resolve. Carrier names vary. Producer identifiers change. Policies move between statuses. A split is special for one product or effective period.
That expertise is valuable, but it should be captured in visible rules and review queues. If the process stops when one employee is unavailable, the agency has a continuity risk.
Producers cannot understand their statements
A producer should be able to trace a payout to the policies, statement lines, split rules, and adjustments behind it. When finance has to rebuild that story by hand for every question, disputes take longer and confidence falls.
Clear statements do not eliminate questions. They make questions specific enough to resolve.
Expected revenue and cash received live in different worlds
An agency may know what a carrier paid without knowing whether the amount was expected. It may forecast from policy data but reconcile from a separate workbook. When those records never meet, missed or unusual payments are harder to spot.
Software should not promise that every difference is an error. It should make the difference visible, attach the supporting records, and give a person a place to decide what happens next.
Eight requirements to evaluate
1. Statement intake that fits your carriers
Ask how the system receives carrier statements today. Does it support the file formats and delivery methods you actually use? Can your team map a new format without a long services project? What happens when a carrier changes a column, label, or identifier?
The demonstration should include an imperfect file, not only a clean sample. See how the system handles duplicates, missing fields, rejected rows, and reprocessing.
2. Matching you can inspect and correct
Automatic matching saves time only when people can understand the result. Ask which identifiers connect a statement line to a policy, writing producer, agency, carrier, and product. Then ask what happens when the match is uncertain.
A useful workflow separates confident matches from exceptions. It should let an authorized reviewer correct a mapping without hiding the original input or silently changing prior periods.
3. Effective-dated compensation rules
Commission rules change. A producer may move to a new level. An override may begin on a specific date. A split may differ by carrier, product, state, or writing agency.
The system should preserve which rule applied to which transaction at the time. If changing today's rate rewrites last quarter's history, the audit trail is not dependable.
4. Hierarchies and splits that match the business
For an FMO or multi-agency organization, a flat producer list is not enough. The software may need to represent uplines, downlines, agencies, teams, and multiple participants in one sale.
Ask whether splits can be percentage-based, fixed, role-based, or explicitly assigned. Test a real edge case, such as a producer changing agencies mid-period or two people sharing credit on one policy. A flexible hierarchy is useful only if permissions prevent the wrong person from seeing another agency's compensation.
5. Expected-versus-paid reconciliation
Reconciliation should show more than a red or green total. Reviewers need to see the expected amount, received amount, difference, source records, and status of the exception.
Ask whether the system can distinguish a timing difference from a missing payment, chargeback, adjustment, or mapping problem. It does not need to make every judgment automatically. It needs to keep the evidence and ownership together until the issue is resolved.
6. Producer statements and dispute handling
Statements should be understandable to the recipient and specific enough for finance to support. Confirm which details appear, how adjustments are explained, when a statement becomes final, and whether a corrected statement preserves the earlier version.
Also define the dispute path. Who can raise a question? Who reviews it? Can supporting notes and documents stay attached to the transaction? How is the final decision communicated?
7. Approvals, permissions, and audit history
Commission data is sensitive. An agency owner, finance operator, producer, and FMO administrator should not automatically have the same access.
Review who can import statements, change rules, approve payouts, reopen a period, export data, and view compensation across agencies. Important changes should show who acted, when, and what changed. Ask how the vendor handles offboarding and access reviews as roles change.
8. Connections to the agency's operating data
Commission software is only as reliable as the records feeding it. Policy identifiers, carrier and product names, producer assignments, effective dates, statuses, and hierarchy data should have clear owners.
Ask whether the product is standalone, part of an agency management system, or connected through an integration. Then map what moves in each direction and how failures are surfaced. A new commission tool should not create another source of truth that finance has to reconcile by hand.
Onyx's insurance management system guide explains the broader system-of-record question. Commission operations are one reason that clean, shared agency data matters, but the commission workflow still needs its own rules, controls, and accountable owner.
A practical demo script for commission tracking software
Bring one representative month of de-identified data to each vendor conversation. Include a normal statement, a chargeback or adjustment, a split, a hierarchy change, and at least one row that will not match cleanly.
Ask the vendor to demonstrate the same sequence:
Import the carrier statement and show validation results.
Match transactions to policies and producers.
Route an unmatched or ambiguous row to a reviewer.
Apply an effective-dated split or override.
Compare expected and received amounts.
Approve a payout and produce a readable statement.
Correct an error without erasing the original history.
Export the records and audit trail.
This exposes more than a feature checklist. You see where configuration ends, where custom work begins, and how the product behaves when the data is not perfect.
Plan the move from spreadsheets in three stages
Stage 1: Define the source of truth
Document which system owns the policy, producer, carrier, product, hierarchy, and compensation rule. Standardize identifiers before migration where practical. If two systems own the same field, decide which one wins and how exceptions are handled.
Stage 2: Run a parallel close
Choose a bounded period, carrier set, or agency group. Process it in both the existing workbook and the new system. Compare totals, line-level matches, exceptions, and producer statements. Do not use agreement at the grand-total level as the only test. Two wrong allocations can cancel each other out.
Stage 3: Lock the operating process
Define who imports, reviews, approves, communicates, and closes each period. Set deadlines and an escalation path. Preserve a controlled way to reopen a period, but make the action visible. Train producers on how to read statements and where to ask questions.
The software does not remove the need for commission operations. It gives that work a dependable structure.
Choose control and clarity over the longest feature list
The best insurance agency commission software is the product that fits your compensation model, carrier inputs, hierarchy, and review process while keeping the numbers explainable. Start with real transactions, test the exceptions, and inspect the controls around every change.
Onyx currently brings CRM, calls, lead routing, policy context, compliance, and reporting together for telephonic insurance agencies. It should not be treated as a current commission-processing product based on this article. If you want to see the agency data foundation Onyx provides and discuss how it fits alongside your commission workflow, book a demo.